Point Clouds
Point clouds can be useful for display raw data from sensors, or displaying huge amounts of point data (1 million +). A custom color can be assigned to each point.
Example Usage
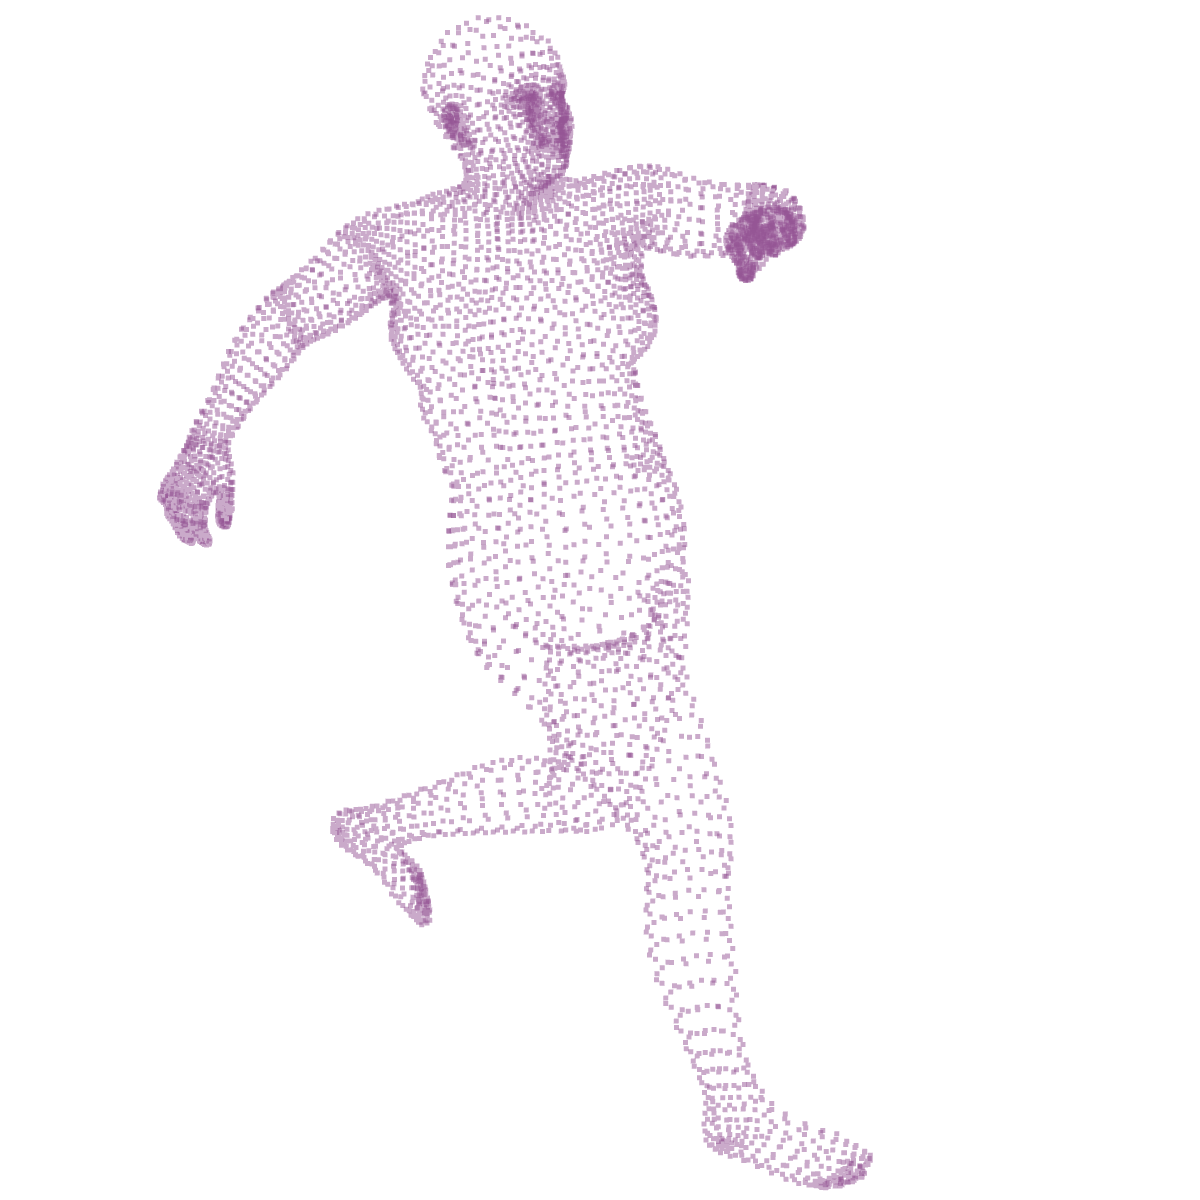
In the load_AMASS.py example, point clouds are used to display the vertices of an SMPL sequence. The sequence of points are expected to be of unifom size for each frame (thus, variable length point clouds are not supported at this time).
# Load an AMASS sequence and make sure it's sampled at 60 fps. This automatically loads the SMPL-H model.
# We set transparency to 0.5 and render the joint coordinates systems.
c = (149/255, 85/255, 149/255, 0.5)
seq_amass = SMPLSequence.from_amass(
    npz_data_path=os.path.join(C.datasets.amass, "ACCAD/Female1Running_c3d/C2 - Run to stand_poses.npz"),
    fps_out=60.0, color=c, name="AMASS Running", show_joint_angles=True)

# Instead of displaying the mesh, we can also just display point clouds.
#
# Point clouds do not actually draw triangulated spheres (like the `Spheres` class does). They
# use a more efficient shader, so that a large amount of points can be rendered (at the cost of not having a proper
# illumination model on the point clouds).
#
# Move the point cloud a bit along the x-axis so it doesn't overlap with the mesh data.
# Amass data need to be rotated to get the z axis up.
ptc_amass = PointClouds(points=seq_amass.vertices, position=np.array([1.0, 0.0, 0.0]), color=c, z_up=True)

# Display in the viewer.
v = Viewer()
v.run_animations = True
v.scene.camera.position = np.array([10.0, 2.5, 0.0])
v.scene.add(seq_amass, ptc_amass)
v.run()